

Key Takeaways
- There is no end in sight for rising debt.
- Within 10 years, we will spend more to pay for the debt than we’ll spend on defense.
- The nation has so far sustained a historically high debt with few repercussions.
- The national debt is a live grenade being handled politically like a hot potato. Only some in politics seem willing to defuse it with concrete steps.
The national debt is a useful, though somewhat imprecise, measure of the federal government’s fiscal responsibility. It continues its steady upward march even though it has been a notable cause of concern for decades. Despite repeated warnings that the debt is too high and that the upward trend is unsustainable, there is little agreement among economists and policymakers on how high the debt can go before it reaches a tipping point and becomes a critical drag on the economy. Some argue that US debt has already crossed that threshold while one school of thought has emerged to claim that there may be no threshold.
In place of a threshold, several organizations have sought to identify a “prudent” target – a level of debt that lawmakers can strive to achieve and then sustain over time that will minimize the risks to the nation’s fiscal health and economic leadership. Many economists and policymakers agree that such a target, and such prudence, is warranted. The target most commonly referenced is a 60% debt-to-GDP ratio.
Despite the uncertainties surrounding the debt, there are a few things of which we can be sure:
- The rising debt reflects an imbalance between tax and spending policies. The dollar value of the debt increases whenever annual spending by the federal government exceeds its revenue. The debt has increased in all but four years since 1980.
- As debt rises, so does the interest that taxpayers pay on the debt. In 2018, the amount of interest paid was $325 billion, or just slightly more than half the amount spent on defense ($623 billion). The Congressional Budget Office projects that interest payments will exceed defense spending within the next 10 years.
- The higher the debt relative to the nation’s gross domestic product (GDP), the greater the risks – to economic growth and stability and to our ability to address the next economic crisis when it occurs. While the debt may not be the most urgent problem facing the nation, it has the potential to undermine our ability to respond to those issues that demand action.
- Without more conclusive evidence clearly supporting a target threshold, the debt will remain a politically-charged issue that will be used conveniently to advance one agenda or another. We can be certain that whatever budget priorities are pursued, they will be vigorously opposed by the political opposition.
Until questions about the debt threshold are resolved with greater certainty, discussions around debt reduction should focus on the levels of uncertainty and risk that we and our elected representatives are willing to accept in order to identify a suitable target threshold. Once defined, the target will inform the choices we need to make in terms of tax and spending policies.
Problem Definition
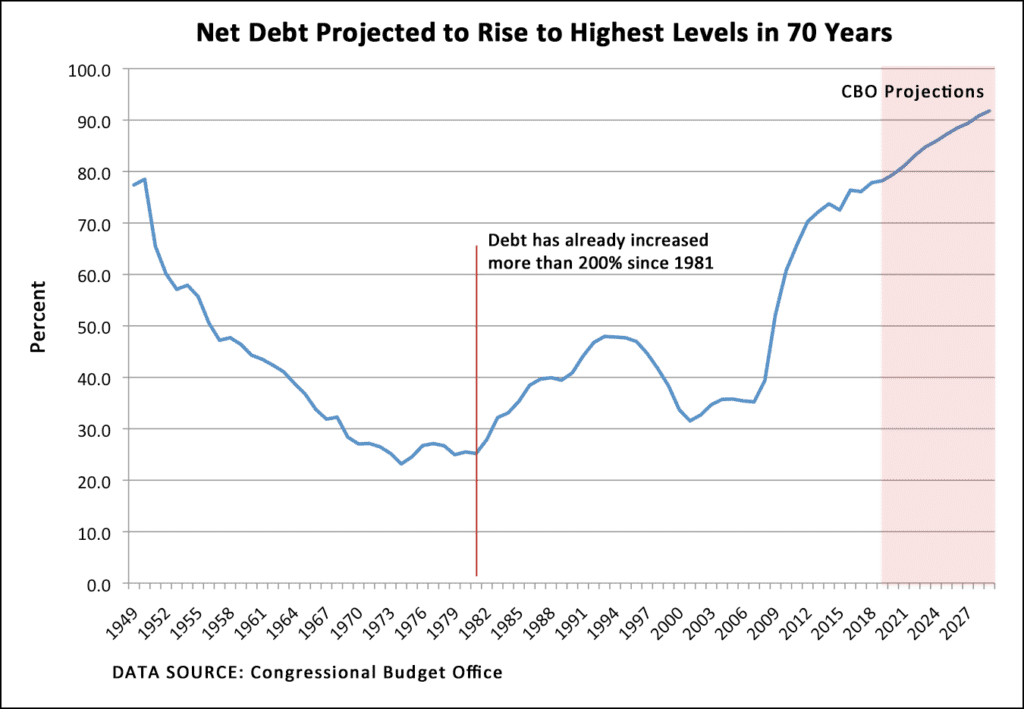
National debt has been viewed as a threat to the nation’s economic durability for decades. For this reason, the nation’s leaders had accumulated debt only during periods of crisis, such as the World Wars and the Great Depression, and immediately began to pay down the debt as soon as it was able. It wasn’t until the 1980s and early 1990s when, for the first time, debt more than doubled at a time when there was no economic or military crisis. The debt has trended upward ever since, fueled in part by spending on the wars in Afghanistan and Iraq and the stimulus programs that pulled the nation out of the Great Recession and the COVID pandemic. The tax cuts enacted at the end of President Trump’s first year in office was the largest recent policy change to substantially increase the debt.
Understanding the problem can be challenging because terminology surrounding the debt is frustrating and confusing. Economists who study debt don’t always use the same definition for terms, and they also don’t agree on which measure of the debt is most relevant to the debate. Below, we identify several key terms used when discussing the debt; it is useful to understand these terms and their differences when reading or listening to discussions of the debt from other sources.
Terms and Measures
Budget Deficit. When the federal government’s annual spending exceeds its revenue, it runs a budget deficit.
National Debt. The national debt is the amount of money the federal government has borrowed to cover budget overruns plus the interest it has to pay on the amount borrowed.
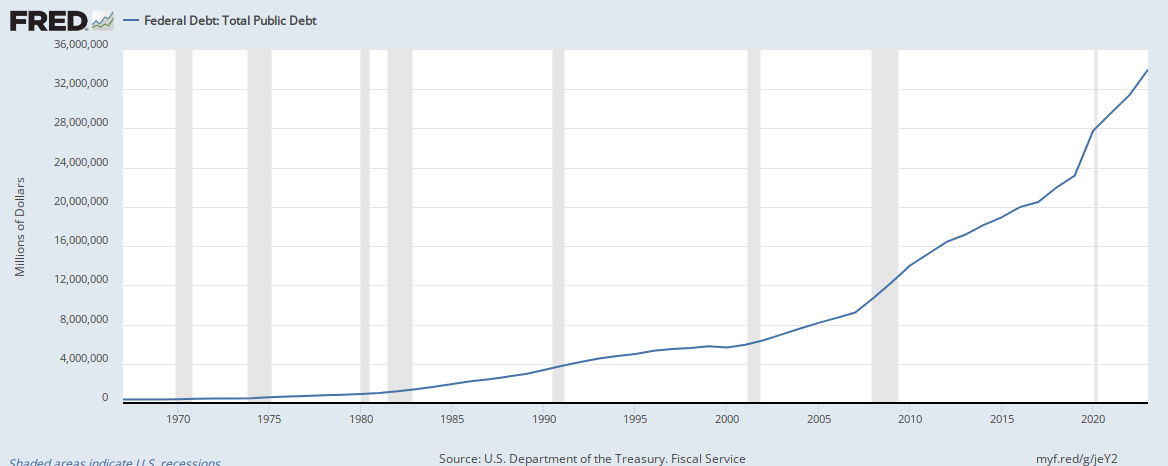
Gross National Debt. The federal government borrows through several mechanisms to cover the additional budget expenditures. Most commonly, it sells US Treasury bonds to third parties such as mutual funds, pensions, foreign governments, and others. It also borrows from other US government funds, like the Social Security Trust Funds. The money it borrows from itself combined with the money owed to third parties is called the gross national debt. The US Treasury Department reported a gross debt of $21.97 trillion at the end of calendar year 2018.
Net National Debt. Federal debt attributable only to third parties, or external debt, is called the net national debt. Net national debt at the end of 2018 was $16.1 trillion.
Public Debt. In the US, economists refer to net debt as the public debt, and some refer to gross debt as “total public debt”. Unfortunately, in some countries, the term “public debt” also includes debt owed by states, provinces, and municipalities, so it is important when reviewing sources that reference the public debt that you understand exactly what meaning is being used. Even some leading economists have overlooked this difference when conducting their research; this has further confused discussions around the debt.
Debt-to-GDP ratio. Most often, economists talk about the debt as a percentage that is defined as the ratio of the dollar amount of the debt to the nation’s gross domestic product (GDP). This debt can be expressed as gross debt-to-GDP, which in 2018 was 107%, or net debt-to-GDP, which was 78% in 2018.
Which Measure to Use
Net debt is typically used as a measure of financial health. External creditors and financial analysts want to know how likely it is that a debtor will be able to pay back its debt to them. Debt owed from one part of the government to another part is not part of their calculations.
At The American Leader, we will use net national debt when discussing the debt problem.
Net national debt is also used by such government sources and organizations as the Congressional Budget Office, the Committee for a Responsible Federal Budget, and the Peter G. Peterson Foundation.
Be aware: The US Congress uses gross debt to define the “debt ceiling” in an attempt to limit the amount that the federal government can borrow. The Organization for Economic Cooperation and Development (OECD) also uses gross debt, while other organizations such as FRED, the economic data website of the Federal Reserve Bank of St. Louis, report both net debt and gross debt. The US Debt Clock, a prominent public monitor of the rising debt, uses the gross debt figure, confusing an otherwise efficient and effective overview of US debt, deficits, spending, and taxation.
Problem Scope
Size of the Debt
As noted under the Definition, the size of the debt is measured in two ways. First, as the dollar value of the debt. For example, the dollar value of the debt at the end of 2018 was $16.1 trillion.
The second measure is debt as the ratio of net debt-to-GDP. Since GDP at the end of 2018 was $20.6 trillion, the size of the debt by this second measurement was 78.1%.
Debt measured as a percentage of GDP is a useful way of evaluating a nation’s ability to repay its debt. The lower a nation’s debt-to-GDP ratio, the more capable it will be to pay off its debt without the need for additional borrowing. The opposite is also true: When debt-to-GDP ratio is high, and particularly if economic growth is slow, investors will be less likely to invest in that nation’s economy and it may be more difficult for the government to borrow money to sustain the economy.
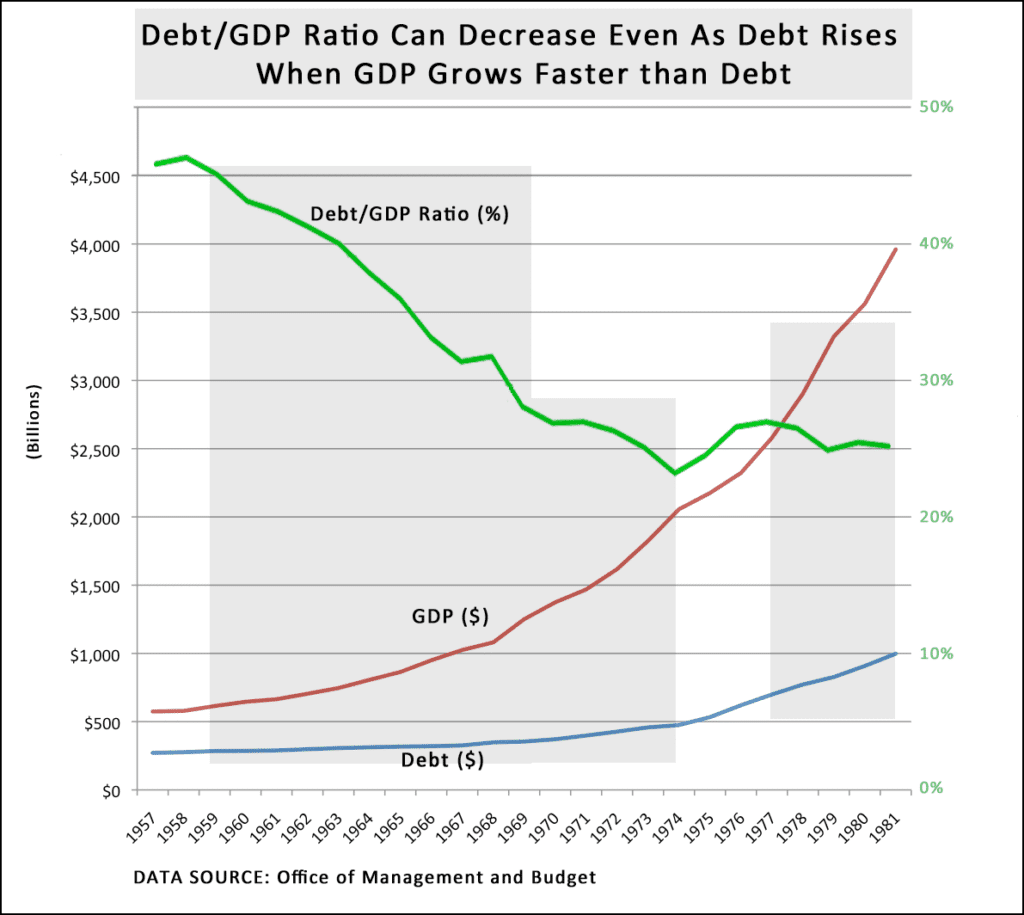
Using the debt-to-GDP ratio as the primary means of evaluating the size of the debt means that when economic growth is strong and outpaces borrowing, the debt-to-GDP ratio shrinks and the nation’s ability to continue borrowing is sustained. In fact, the size of the debt in dollars can actually increase even when the debt-to-GDP ratio decreases. This was the trend from the 1950s into the 1970s.
Debt is Rising
After decades of steady decline, the debt-to-GDP ratio began to grow again starting in 1981, and has for the most part continued an accelerated upward trajectory since.
Many economists and business people do not see this growth in the debt as sustainable and would like to see the federal government develop a plan to bring it under control before we reach a crisis point that undermines economic growth. Exactly when that crisis point will arrive is a point of debate. It is an elusive figure that seems to defy a single standardized number and is highly dependent on the pace of economic growth as well as tax and spending policies.
Following passage of the tax cut bill in December 2017 and an increase in spending, debt increased to $15.7 trillion in FY 2018 (the government’s fiscal year ended Sep 30, 2018). Our federal government owed so much money to others that spending for the fiscal year included $325 billion in interest payments on the money borrowed to date. That’s almost $900 million a day. Based on current tax and spending laws, the Congressional Budget Office estimates that the debt will approach 95% of GDP at the end of FY 2029.
Limits to What We Know
Searching for a Policy Target
Once we get past the confusing issue of which definition people are using when they reference the “national debt”, we find that there is one key question that needs to be answered:
How high can we allow the debt to go before it reaches a tipping point for the economy when risks posed by the debt spiral beyond our control?
In 1992, businessman Ross Perot ran as independent candidate for President because he believed the rising national debt was a problem that needed to be nipped in the bud. At that time, the net debt was 48% of GDP – about 30% lower than the level we see today. However, the size of the debt had almost doubled in the twelve years leading up to the 1992 election – an unsustainable trend in the eyes of Perot and many others. Perot lost the election, but he succeeded in putting the debt issue near the center of public debate.
Despite decades in which the rising debt has sometimes served as a useful political weapon, the nation has apparently felt no ill effects from the debt as economists continue to struggle to define the tipping point at which the debt will affect economic growth. Without a clear breaking point, it is challenging to develop meaningful policies to manage the debt and its impact on the economy.
Thresholds Based on an Imperfect Science
Several general threshold numbers have been proposed. In 2010, the World Bank conducted a study that suggests that 77% is a useful average figure, but the study acknowledges that figure may be higher or lower depending on the specific circumstances of a given country. For the US, which boasts the largest economy in the world, that threshold would be well above the 77% mark.
Another famous study, also published in 2010, by Harvard University economics professors Carmen Reinhart and Kenneth Rogoff concluded that 90% is a useful threshold. Despite serious flaws, including the researchers’ use of gross debt rather than net debt, the 90% figure gained some traction in the debt debate. The Economist noted that subsequent studies, including one from the IMF, had also supported the 90% figure, or something close to it. The 2013 article concluded that the topic is highly charged politically and that further research requires the most “rigorous standards”.
In 2017, a team of economists published a new study based on the Reinhart-Rogoff dataset. Their findings suggested a threshold around 30%. The authors note, however, that the relationship between the debt threshold and economic growth is tenuous and in need of further research.
Debt-Is-(Almost)-Irrelevant Theory
Modern Monetary Theory (MMT) takes a new approach that says budget deficits don’t matter, provided that the deficits are incurred through spending on line items like education, infrastructure, or research and development that all have potential future payoffs. MMT argues that revenue is not essential to cover budget overruns, since the federal government has the power to print more money and the capacity to control inflation.
This seemingly radical idea is, according to Forbes columnist Milton Ezrati and The Economist, deeply rooted in a nuanced understanding of Keynesian economics. Although MMT is touted in support of the progressive policy recommendations of Bernie Sanders and Alexandria Ocasio-Cortez, Wall Street veteran Ezrati notes that MMT is consistent with the Republicans’ interest in dynamic accounting, which recommends that budget effectiveness be evaluated on the economic response to policy and not solely on the surplus or deficit it generates. Ezrati likens MMT to a new version of supply side economics, while The Economist cites former treasury secretary Larry Summers, who called it the new “voodoo economics”.
Some reports suggest that Wall Street money managers are receptive to MMT ideas under certain circumstances. One of the chief ideas of MMT is that interest rates will remain low in periods of very high government debt. The NY Times reported that asset management firm Pimco relied on this idea as a critical part of its investment framework following the 2008 financial crisis. The Times cites Pimco’s former chief economist, Paul A. McCulley, who said that MMT contributed to Pimco’s ability to make good bets during this time that generated substantial returns.
Setting a Prudent Target
In lieu of hard scientific data connecting a clear debt threshold to economic growth or supporting MMT, a consensus has emerged around a net debt-to-GDP ratio of 60%. In 2012, Michael A. Peterson, CEO of the Peterson Foundation, cited the following reasons to support the 60% target:
- It is a target endorsed by “many budget experts and economists”;
- “It was the maximum allowable level of debt for countries originally seeking to join the Euro”; and
- Five ideologically diverse think tanks targeted 60% as their goal in fiscal plans submitted to the Peterson Foundation.
The Committee for a Responsible Federal Budget also advises a 60% target over the long-term. Given the scale of the debt problem, these organizations generally talk about the need to first stabilize the debt at its current level so that it is no longer rising, and then determine a strategy to reduce it to an acceptable target level.
No one disputes the potential negative impacts of a national debt that is too high, and most agree that the debt threshold varies based on the state of development of the national economy. For example, emerging markets may have a lower threshold than developed economies like those in the US and western Europe.
The decision to add to the debt also depends what the money is spent on. While it can make sense to borrow to invest in, for example, infrastructure that has some promise of economic return, it generally is not prudent to borrow funds to cover operating or ongoing expenses. The drag of debt should be weighed against the benefit of what’s being bought with the debt.
What’s at Stake
While there is not yet a consensus regarding the debt threshold, most economists recognize the risks of high debt. As the debt rises, our ability as a nation to continue to borrow money grows more limited. This raises the stakes in two important areas.
Limited Response to Emergencies
The higher the debt, the greater limits there are on the federal government to respond to emergencies, such as natural disasters, wars, and economic recessions. When the economy plunged in 2008, the debt was 39% of GDP and the federal government was able to borrow and spend substantial sums to keep the economic engines of growth running. Should the debt continue its upward march and another economic crisis strikes, it is not clear that as a nation we’ll be able to borrow and spend our way out of it as we’ve done during past crises.
Reduced Public Investment
Federal funding is vital to the economy in a number of areas: military, infrastructure, research and development of new technologies, education, environmental protection and conservation, healthcare, and other important social services. As the debt grows, our ability to fund these and other programs may be severely limited, especially if nothing is done to increase the government’s revenues through higher taxes.
US Global Leadership
Since World War II, the US has been the undisputed global leader in helping to rebuild and develop national economies in Europe and elsewhere around the world. In doing so, our leadership created new markets for the goods and services produced by innovative and industrious American-based companies. This economic engine powered the nation as one of two world superpowers during the Cold War, and carried us through the transition to a multilateral global economy in the 1990s and beyond.
Increased interest payments on the debt have the potential to reduce our ability to sustain and direct the economy into new markets as the government has done historically. Our ability to create and export such markets has been a hallmark of our global leadership and warrants attention to ensure that we never reach the point where we must limit our choices because of high interest payments on the debt.
Potential Obstacles
Unproductive Debate
Debate over the appropriate size and responsibilities of the federal government is as old as the nation. The national debt plays nicely into this storyline for those on the Right who don’t like big government and the taxes required to sustain it. On the Left, which is more receptive to calling upon the federal government to solve problems that the markets can’t or won’t, the size of the federal government is not generally an issue and the debt rarely takes center stage as a matter of concern.
Conservatives have raised alarms over the years about the growing debt problem while invoking fears of creeping socialism in its criticisms of “big government” and the entitlement programs of “tax and spend liberals”. The rhetoric has resonated with some Americans but has yet to translate into concrete policy changes to bring down the debt.
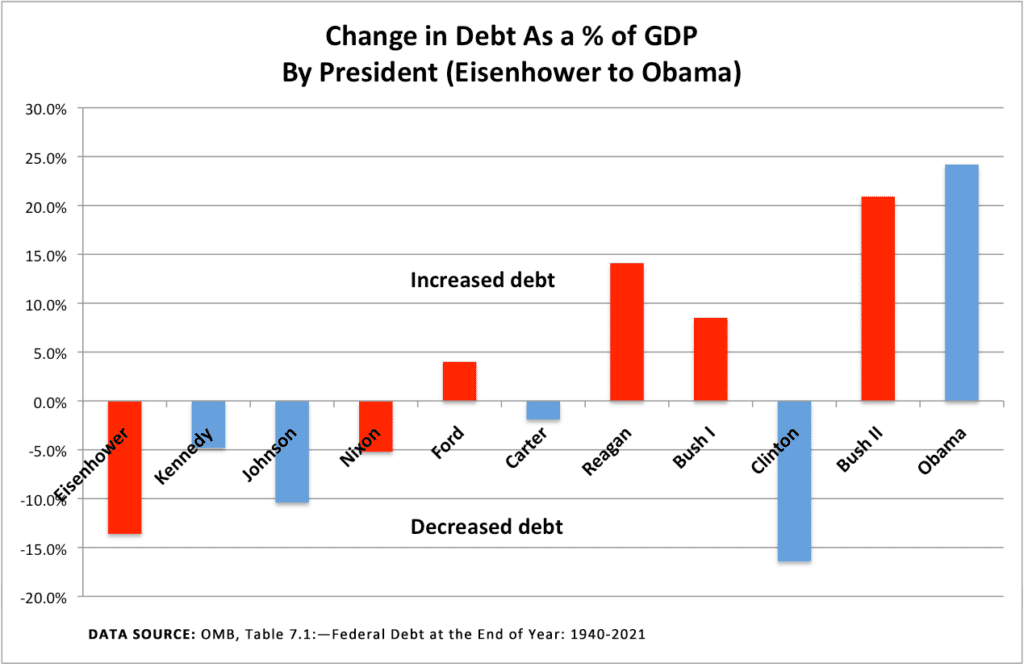
In fact, data from the Office of Management and Budget tells a surprisingly different story. Since 1953, the debt as a percentage of GDP actually was reduced under four of five Democratic presidents, whereas it increased under four of the six Republicans who completed their terms during this time. In just his first year in office, President Trump and the GOP-controlled Congress embraced tax cuts that will add at least $1.5 trillion to the debt over 10 years. The one time that the debt rose under a Democrat was when President Obama spent the nation out of the Great Recession that started the year before he took office.
As noted, on the political Left, rising debt is a lesser priority – or not a priority at all – as the focus there is on reducing income and wealth inequality. Progressives’ primary concern with the debt is that conservatives will use the issue as a mechanism for eliminating needed social and environmental programs. The 2017 tax bill only heightened the Left’s concern in this regard, as several conservatives in and out of office have suggested a “next step” that would involve additional tax cuts coupled with budget cuts to critical social programs.
Reluctance to Cut Valued Programs and Organizations
As the Growth of Government storyline indicates, many parts of the federal government were created to implement solutions to specific problems that affected various constituencies. Other parts of the government support scientific research, education, and other investments in the future health of the economy. Efforts to eliminate or reduce funding to these programs and government organizations swiftly runs into opposition from those constituencies that depend on them, and from those who see a need to keep the solutions and investments in place.
The bottom line: spending cuts will be difficult to achieve because it will force hard decisions on politicians who are reluctant to reduce spending on popular programs and who don’t want to lose the support of voters.
Infrastructure and Climate Change Requirements
The nation has already identified infrastructure rebuilding as a substantial area of new spending to enhance prospects of future economic growth. The American Society of Civil Engineers reported a funding gap of $2 trillion in the $4.5 trillion budget needed through 2025 to rebuild the nation’s infrastructure.
Spending demands also are increasing as the effects of climate change begin to be felt. Already in the last 30 years, the number of extreme weather events has more than doubled, and the amount of damage they’ve inflicted has risen by 175% to $750 billion since 2009. In 2016, the United Nations Environmental Program estimated that climate change adaptation costs – building things like sea walls around New York City and Boston and more resilient roads and sewage systems – will cost between $140 billion and $300 billion per year over the next ten years. By 2050, that range is estimated to be between $280 billion and $500 billion per year, and UNEP cautions that major information gaps suggest this range is likely to raise costs higher.
Additional spending needs resulting from another economic crisis, new wars, and domestic security requirements could make it even more difficult to establish a more sustainable budget policy that reflects the needs and priorities of the majority of Americans.
Additional Considerations
Risk Tolerance and Economic Variability
Deciding on the best approach to controlling the debt depends on our willingness to accept risk and potentially reduced national economic flexibility. The higher we allow the debt to go, the more risk we take on as we approach a currently unknown threshold beyond which recovery may be beyond our tolerance for financial sacrifice. As global circumstances change, it is possible that our risk tolerance might also need to be re-evaluated in order to make proper adjustments to debt policy.
As we seek to balance our risk tolerance with tax and spending priorities, the debt becomes a helpful mechanism that shows us we actually have a choice between potential future risks of continued debt increases and improved stability that results from reining in debt growth. Actively choosing the first option – more potential risk – is a choice for the status quo that could eliminate the question of debt control and budget deficits from political attack strategies, while the latter would require a more serious discussion of national priorities that leaves us with three policy options: 1) raise taxes, 2) cut spending, or 3) some combination of increased taxes and reduced government spending.
Growth Prospects
Those who are content to watch the debt rise generally do so from a faith that the US and global economies will continue to grow at a fast enough rate that the debt as a percentage of GDP actually shrinks. Even if the total dollar value of the debt continues to increase, so long as the economy grows faster than the debt, many economists will tend to feel comfortable with the size of the debt. If the economy should grow more slowly over an extended period of time, the implications are three-fold:
- The debt will grow faster than our ability to pay it back, threatening our leadership position in the global economy;
- Pressure will increase on the federal government to find ways to avoid adding more to the debt and to begin paying it off; and
- We will have more restrictions on our ability to recover from possible recessions, to sustain existing programs, to execute new policies that require more spending, or to initiate tax cuts to assist the middle class.
Tax and Spending Priorities
The federal budget includes spending on a broad range of programs that deliver services to the American people. These programs are often essential to personal health and well-being or they may be vital to sustaining economic growth, our national security, and our leadership around the world. If serious efforts are to be made to reduce the debt and maintain control over the economy, we may need to make some difficult choices in order to reduce our dependence on borrowing. Below are some questions worth considering to better balance tax and spending policies:
- Do we sustain all current programs at their current levels? If so, we’ll need to increase taxes. Do we levy taxes equally on all Americans, or progressively on those who can afford to be taxed more?
- Do we modify these programs to reduce their costs? If so, which programs do we adjust and by how much? It is also likely that we will still need to increase taxes to pay for the programs.
- Do we simply cut these programs so that we can keep taxes low, even for those who can potentially afford to pay more?
- How do we afford new programs like jobs transition and relocation costs for coal miners? Or how do we implement new climate change technologies? Do we automatically raise taxes to cover the new costs, or do we look to make cuts in other programs, or a combination of both approaches? If cuts are deemed appropriate, which programs receive them?
The answer to many of these questions may depend on the prism through which you view the social contract that binds us together as a nation.
Creating a Debt Brake
There is a golden rule of fiscal policy that suggests that governments should only borrow to fund investments that benefit future generations. Programs that benefit people today should be fully funded by existing tax revenue and never by borrowing.
In much of the developed world, this rule has been made into law in various ways and with generally positive results. Sometimes, it has required changes to a nation’s constitution in order to create the needed debt brake. Efforts in the US to apply a legislatively-created brake, including a spending cap and an annual deficit target, have thus far failed.
Frequently Asked Questions
Why is gross national debt reported by some government websites while net national debt is often cited elsewhere?
To meet regulatory requirements, gross national debt is still commonly reported, and can lead to some confusion regarding the size of the debt. The gross national debt reported by the Federal Reserve as of July 1, 2021 was 122% of GDP (as estimated in a December 2021 update); the net national debt, used by the Congressional Budget Office, was 78% of GDP as of September 30, 2021 (end of the government’s fiscal year).
Tools & Resources
Make your voice heard in government
GovTrack.us enables you to track and learn about legislation proposed in Congress. It can also connect you with your US senators and representative so you can tell them how you feel about the bills that interest you.
VOTE411 was launched by the League of Women Voters Education Fund (LWVEF) in October 2006. It is a one-stop-shop for election-related information, including responses from state and local candidates to specific questions.
Project VoteSmart provides free, factual, unbiased information on candidates and elected officials to all Americans. It aims to give you the information you need to … vote smart.
Examine Your Budget Priorities
The Debt Fixer is an intuitive interactive tool that challenges you to establish a federal budget that reduces the debt. This is a great tool to examine and balance your priorities for the nation – the trade offs are not always so obvious and the decisions can be hard. The Committee for a Responsible Federal Budget, which created the tool, has set up this special link for visitors to The American Leader. At some point, we will share and then regularly update the results.
How old will you be when Social Security’s funds run out? Enter the year you were born to find out what’s in store for you, then design your own fix for social security. Another free tool from the Committee for a Responsible Federal Budget.
Trade-Offs: Your Money, Your Choices is a tool from the National Priorities Project that gives you clear, pre-defined spending options that you can select as trade-offs in realigning federal budget priorities to what you think they ought to be. It’s not quite so intuitive to use and navigate to an endpoint, but it does a nice job of challenging us to think about some tough choices.
Your Federal Income Tax Receipt is another interactive tool from the National Priorities Projects that shows how your federal tax dollars were spent. It links to the Trade-Offs tool (above) to enable you to “reallocate your tax dollars”.
Charity Navigator offers this list of action and advocacy organizations that support environmental protection and conservation issues. It’s nicely organized and presents budget, program, and historical information on each so you can decide which organization is most worthy of your investment of time and/or money.
Accountability During Crises
COVID Money Tracker, launched by the Committee for a Responsible Federal Budget, says it “will track every significant financial action taken to address the current crisis and then follow the dollars over time to provide valuable information on how much has been disbursed (or paid back) and to whom.”
Stimulus.org was the first effort by the Committee for a Responsible Federal Budget to track stimulus spending by the government during a economic crisis. It now exists for historical purposes and is no longer being updated.
Learn More About the Debt
The Comprehensive Solutions on the Peterson Foundation website introduces the Solutions Initiative, which in 2015 brought together recommendations from five policy organizations across the political spectrum. The Solutions Initiative III summarizes these recommendations and offers charts that make it easy to compare them to each other and to current federal policy.
“Federal Government Growth Before the New Deal” offers the perspective of Professor Randall G. Holcombe, who teaches economics at the University of Florida. In his essay, Prof. Holcombe explains that by 1913, the federal government had evolved to be a protector of the nation’s economic well-being. Published on the website of the Foundation for Economic Education.
Running on Empty: How the Democratic and Republican Parties Are Bankrupting Our Future and What Americans Can Do About It is the book by Peter G. Peterson that eventually led to the establishment of the Peter G. Peterson Foundation. It was published in 2004.
Sources
The URLs included with the sources below were good links when we published. However, as third party websites are updated over time, some links may be broken. We do not update these broken links. If you are interested in the source, it may be possible to find it by copying and pasting the URL into a search on the Internet Archive Wayback Machine. From the search results, be sure to choose a date from around the time our article was published.
Ross Perot, “Balancing the Budget and Reforming Government”, 1992 campaign infomercial, https://www.youtube.com/watch?v=mPIVI0CbCmg, accessed Aug 7, 2019
Peter G. Peterson Foundation, “Debt & Deficit: Our Work”, https://www.nationalpriorities.org/works-on/debt-deficit/
Peter G. Peterson Foundation, “WHY YOU SHOULD CARE THAT 2017 TAX CUTS WILL ADD TO THE NATIONAL DEBT”, Dec 20, 2017, https://www.pgpf.org/blog/2017/11/why-you-should-care-that-tax-cuts-add-to-the-national-debt
Peter G. Peterson Foundation, “A Strong Fiscal Foundation for Economic Growth”, https://www.pgpf.org/multimedia/a-strong-fiscal-foundation-for-economic-growth (good basic video)
Peter G. Peterson Foundation, “Long-Term Debt: An Unsustainable Future”, http://visualize.pgpf.org.s3-website-us-east-1.amazonaws.com/long-term-debt/ (very good presentation with nice interactive that allows comparison of plans for controlling debt)
Scott A. Wolla, “Choices are Everywhere: Why Can’t We Just Have It All?”, FRED, January 2013, https://research.stlouisfed.org/publications/page1-econ/2013/01/01/choices-are-everywhere-why-cant-we-just-have-it-all/
Matt Phillips, “The Long Story of U.S. Debt, From 1790 to 2011, in 1 Little Chart”, The Atlantic, Nov 13, 2012, https://www.theatlantic.com/business/archive/2012/11/the-long-story-of-us-debt-from-1790-to-2011-in-1-little-chart/265185/
Leonard E. Berman, “Which Presidents Spent the Most?”, Tax Policy Center, Nov 2, 2012, http://www.taxpolicycenter.org/taxvox/which-presidents-spend-most-you-might-be-surprised
Congressional Budget Office, Data Underlying Figures spreadsheet, “An Update to the Budget and Economic Outlook: 2019-2029”, Congressional Budget Office, Aug 21, 2019, https://www.cbo.gov/publication/55551
CBO, The Budget and Economic Outlook: 2018 to 2028, Apr 9, 2018, https://www.cbo.gov/publication/53651
CBO, Infographic: The Federal Budget in 2017, March 2018, https://www.cbo.gov/publication/53624
Inside Gov, 2017 United States Budget Estimate, no date, http://federal-budget.insidegov.com/l/120/2017-Estimate
Wikipedia, “National Debt of the United States: Debt Holdings”, https://en.wikipedia.org/wiki/National_debt_of_the_United_States#Debt_holdings
David Gelles, “They’re Rich and They’re Mad About Taxes (Too Low!)”, NY Times, Feb 12, 2019, https://www.nytimes.com/2019/02/12/business/rich-people-against-tax-cut.html, accessed Mar 27, 2019
Binyamin Applebaum, “The Federal Debt Is Rising. Concern Is Not.”, Feb 19, 2019, https://www.nytimes.com/2019/02/15/us/politics/national-debt-trump.html, accessed Apr 1, 2019
Data
Congressional Budget Office, “The Federal Budget in 2018: An Infographic”, Jun 18, 2019, https://www.cbo.gov/publication/55342, accessed Jul 19, 2019
Congressional Budget Office, “Updated Budget Projections: 2019 to 2029”, Table 1, May 2019, www.cbo.gov/publication/55151, accessed Aug 18, 2019
US Treasury Department, “Monthly Statement of the Public Debt of the United States: December 31, 2018”, https://www.treasurydirect.gov/govt/reports/pd/mspd/2018/opds122018.pdf, accessed Jul 2019
US Treasury Department, The Daily History of the Debt Results, https://www.treasurydirect.gov/NP/debt/search?startMonth=12&startDay=31&startYear=2018&endMonth=&endDay=&endYear=, accessed Aug 18, 2019
BEA News Release, “National Income and Product Accounts – Gross Domestic Product, Second Quarter 2019 (Advance Estimate) and Annual Update”, pg. 14 Table 7, US Bureau of Economic Analysis, Jul 26, 2019, https://www.bea.gov/system/files/2019-07/gdp2q19_adv_1.pdf, accessed Aug 18, 2019
Office of Management and Budget, Historical Tables: Table 7.1—Federal Debt at the End of Year: 1940-2021, https://obamawhitehouse.archives.gov/omb/budget/Historicals, accessed Apr 9, 2018
FRED, Federal Debt: Total Public Debt as a Percentage of Gross Domestic Product (GDP), https://fred.stlouisfed.org/series/GFDEGDQ188S
FRED, Federal Surplus or Deficit [-] as Percent of Gross Domestic Product,
https://fred.stlouisfed.org/series/FYFSDFYGDP
FRED, Federal Debt: Total Public Debt, expressed in trillions of dollars: https://fred.stlouisfed.org/graph/fredgraph.png?g=jeY2, expressed as percentage change from prior year: https://fred.stlouisfed.org/graph/fredgraph.png?g=jeYa
Definitions
Kimberly Amadeo, “Public Debt With Its Pros and Cons”, The Balance, updated Feb 13, 2019, https://www.thebalance.com/what-is-the-public-debt-3306294, accessed Jun 2019
Will Kenton, “Debt-to-GDP Ratio Definition”, Investopedia, updated Apr 17, 2019, https://www.investopedia.com/terms/d/debtgdpratio.asp, accessed Jun 2019
Kathy Ruffing, James R. Horney, and Paul N. Van De Water, “Fiscal Commission Should Not Focus on Gross Debt”, Center on Budget and Policy Priorities, Jul 22, 2010, https://www.cbpp.org/research/fiscal-commission-should-not-focus-on-gross-debt, accessed Jun 2019
Debt Threshold
The Economist, “How much is too much?”, Jun 3, 2015, https://www.economist.com/blogs/freeexchange/2015/06/public-debt
The Economist, “Debt and Growth: Breaking the Threshold”, Mar 1, 2014, https://www.economist.com/news/finance-and-economics/21597933-new-research-suggests-debts-trajectory-affects-growth-more-its-level-breaking 5
Jonathan D. Ostry, Atish R. Ghosh, and Raphael Espinoza, “When Should Public Debt Be Reduced?”, International Monetary Fund, June 2015, http://www.imf.org/en/Publications/Staff-Discussion-Notes/Issues/2016/12/31/When-Should-Public-Debt-Be-Reduced-42931
Andrea Pescatori, Damiano Sandri, and John Simon, “Debt and Growth: Is There a Magic Threshold?”, International Monetary Fund, February 2014, https://www.imf.org/en/Publications/WP/Issues/2016/12/31/Debt-and-Growth-Is-There-a-Magic-Threshold-41352
Thomas Grennes, Mehmet Caner, and Fritzi Koehler-Geib, “Finding the Tipping Point — When Sovereign Debt Turns Bad”, The World Bank, Aug 2010, https://elibrary.worldbank.org/doi/abs/10.1596/1813-9450-5391, abstract accessed Jun 19, 2019
Anis Chowdhury, “Is there an optimal debt-to-GDP ratio?”, VoxEU.org, Nov 9, 2010, https://voxeu.org/debates/commentaries/there-optimal-debt-gdp-ratio, accessed Jun 15, 2019
Lee, Sokbae et al., “Testing for a Debt-Threshold Effect on Output Growth.” Fiscal studies vol. 38,4 (2017): 701-717. https://onlinelibrary.wiley.com/doi/full/10.1111/1475-5890.12134, accessed Jun 24, 2019.
The 90% Question
Carmen M. Reinhart, Kenneth S. Rogoff, “Growth in a Time of Debt”, NBER Working Paper No. 15639, January 2010, Revised December 2011, http://www.nber.org/papers/w15639
Laurent Belsie, “Growth in a Time of Debt”, NBER Digest, no publication date, http://www.nber.org/digest/apr10/w15639.html
John Cassidy, “The Reinhart and Rogoff Controversy: A Summing Up”, The New Yorker, Apr 26, 2013, https://www.newyorker.com/news/john-cassidy/the-reinhart-and-rogoff-controversy-a-summing-up
The Economist, “The 90% question”, Apr 20, 2013, https://www.economist.com/news/finance-and-economics/21576362-seminal-analysis-relationship-between-debt-and-growth-comes-under
Balázs Égert, “The 90% public debt threshold: the rise and fall of a stylized fact”, 2015, Applied Economics, 47:34-35,3756-3770, DOI: 10.1080/00036846.2015.1021463
Modern Monetary Theory
Milton Ezrati, “What is Modern Monetary Theory?”, Forbes, May 28, 2019, https://www.forbes.com/sites/miltonezrati/2019/05/28/what-is-modern-monetary-theory/#6aefe9fd3186, accessed Aug 20, 2019
The Economist, “Is modern monetary theory nutty or essential?”, Mar 14, 2019, https://www.economist.com/finance-and-economics/2019/03/14/is-modern-monetary-theory-nutty-or-essential, accessed Aug 20, 2019
Peter Coy, Katia Dmitrieva, and Matthew Boesler, “Warren Buffett Hates It. AOC Is for It. A Beginner’s Guide to Modern Monetary Theory”, Bloomberg Businessweek, Mar 21, 2019, https://www.bloomberg.com/news/features/2019-03-21/modern-monetary-theory-beginner-s-guide, accessed Aug 20, 2019
Dylan Matthews, “Modern Monetary Theory, explained”, Vox, Apr 16, 2019, https://www.vox.com/future-perfect/2019/4/16/18251646/modern-monetary-theory-new-moment-explained, accessed Jun 24, 2019
David Harrison and Kate Davidson, “Worry About Debt? Not So Fast, Some Economists Say”, Wall Street Journal, Feb 17, 2019, https://www.wsj.com/articles/worry-about-debt-not-so-fast-some-economists-say-11550414860, accessed Jun 24, 2019
Greg Robb, “What Modern Monetary Theory gets ‘plain wrong,’ according to former IMF chief economist”, MarketWatch, Jun 11, 2019, https://www.marketwatch.com/story/what-modern-monetary-theory-gets-plain-wrong—former-imf-chief-economist-2019-06-11, access Jun 24, 2019
Patricia Cohen, “Modern Monetary Theory Finds an Embrace in an Unexpected Place: Wall Street”, NY Times, Apr 5, 2019, https://www.nytimes.com/2019/04/05/business/economy/mmt-wall-street.html, accessed Jun 24, 2019
Katia Dmitrieva, “Wall Street Economists Wade Into the MMT Debate in a Big Way”, Bloomberg, Apr 8, 2019, https://www.bloomberg.com/news/articles/2019-04-08/goldman-sees-mmt-positives-as-economists-debate-who-buys-lunch, accessed Jun 24, 2019
Social Security
Email interviews with William Gale, Brookings Institution, and Patrick Newton, Committee for a Responsible Federal Budget, 2018
Social Security Administration, History: Debunking some myths, https://www.ssa.gov/history/InternetMyths2.html
Social Security Administration, Frequently Asked Questions about the Social Security Trust Funds, https://www.ssa.gov/oact/progdata/fundFAQ.html
https://en.wikipedia.org/wiki/Social_Security_Trust_Fund
Teresa Ghilarducci, “Social Security Does Not Add To The Federal Deficit”, Forbes, Oct 19, 2018, https://www.forbes.com/sites/teresaghilarducci/2018/10/19/social-security-does-not-add-to-the-federal-deficit/#5cc5370e2081, accessed Jan 8, 2019
Credits
Author: George Linzer
Reviewed: Committee for a Responsible Federal Budget and William Gale
Published: November 5, 2019
Last updated: February 8, 2022
Feature image: doomu, modified by George Linzer
Related Pages


Progress Updates

Why Applaud as the National Debt Continues to Soar?
Recently released government projections estimate the national debt will grow by $21.2 trillion over the next 10 years – a 78% increase raising the debt to more than $48 trillion. As bad as that sounds, the Committee for a Responsible Federal Budget, a bipartisan group that advocates for fiscal restraint, would like you to know the news could have been worse.

Bipartisan Hope Isn’t Helping Divided Congress Avoid Debt Crisis
Our Congress has two faces: We saw the authoritarian one during the rancorous vote for House Speaker, while the other is seen in an op-ed that lauds the bipartisan collaboration that produced over 200 recommendations for making Congress work more efficiently. As we brace for another game of chicken over the debt ceiling, it’s clear which face is doing the talking.

Building a More Perfect Union in 2023
2022 ended with sighs of relief and celebrations that the red wave didn’t happen, that voters rejected efforts to codify strict anti-abortion laws, that the budget deficit was cut in half, and that there was some bipartisan support for climate change action and improved access to healthcare. All good, but there is still work to be done.
